Why?
Well, I had to start somewhere to get my analysis section off the ground. Understanding how wages are controlled in career mode has interested me for a while actually. Anecdotally, I’ve noticed patterns while playing FIFA 18 (and previous iterations), but I wanted to do a deep dive on this.
How?
The process for this was fairly simple, if somewhat time consuming. I pulled the data on all players in the four English leagues (Premier League, Championship, League One and League Two). The key data points I wanted were Overall Rating and of course Wages.
Collecting close to 3000 records (totalling around 15,000 data points) took some time.
Wage Analysis Trend: All Data
Let’s jump right in and keep it simple for now. If we put all the players on a scatter plot for Overall Rating (X-axis) against Wages (Y-axis), the resulting graph looks like this.
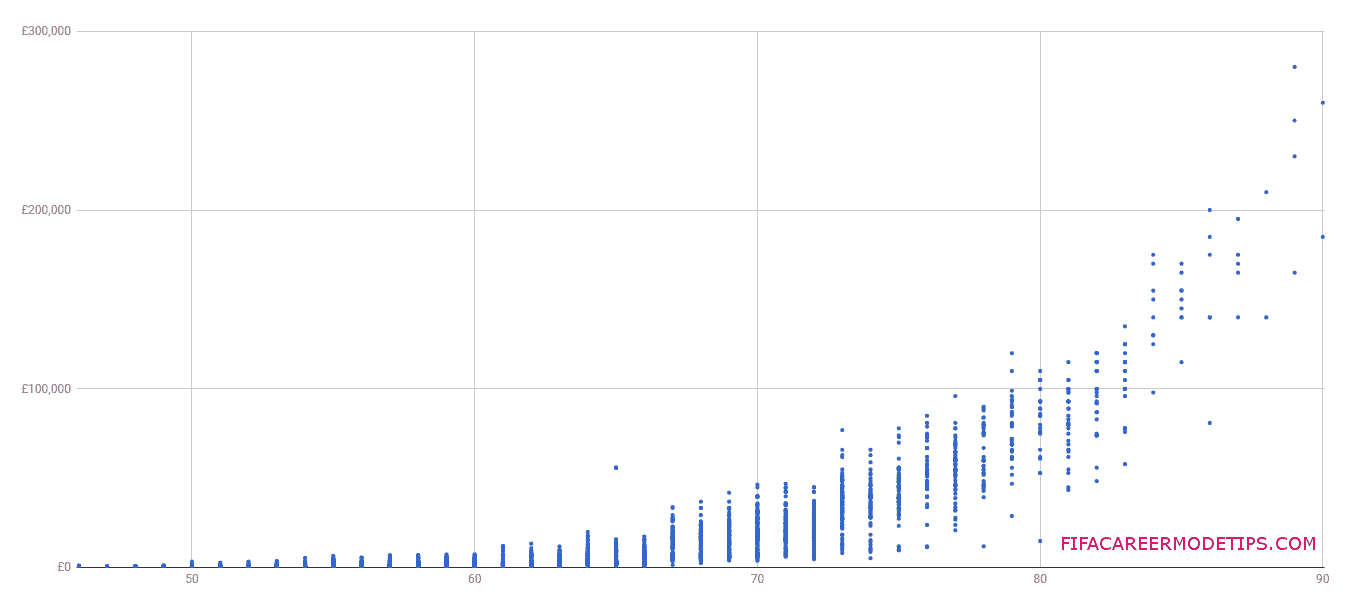
It’s not the best graph by any means but I think it’s important to show all of the data first of all. Sometimes doing this, rather than jumping ahead, helps me to come up with better questions when I get around to the more detailed parts.
Observations
The first thing to note is the basic trend that we can see in the shape of the scatter plot. As you would expect there is positive correlation between Overall Rating and Wages, but it is not linear. Instead, the ‘line’ gradually curves upwards, getting more and more steep with the higher rated players. You’ve probably noticed in your own career modes that the wage demands of highly rated players (85+) tend to increase rapidly.
The other thing I want to talk about is sample sizes. The graph is strongest and most accurate up to 83 on the Overall Rating axis. This is simply because most of the players in the English leagues are below this level. For an Overall Rating of 84 and beyond, there aren’t as many players, so the graph is more sparsely populated. This doesn’t invalidate the graph, or the data of players rated 84 and over – it just means we have to take it with a pinch of salt.
The other key observation I noticed was the variation in wages between players with the same rating. For some of the data points (overall rating) the difference is around £100,000. This is a significant variation, so we need to go deeper to better understand why some players are being paid more than others.
Wage vs Overall Rating
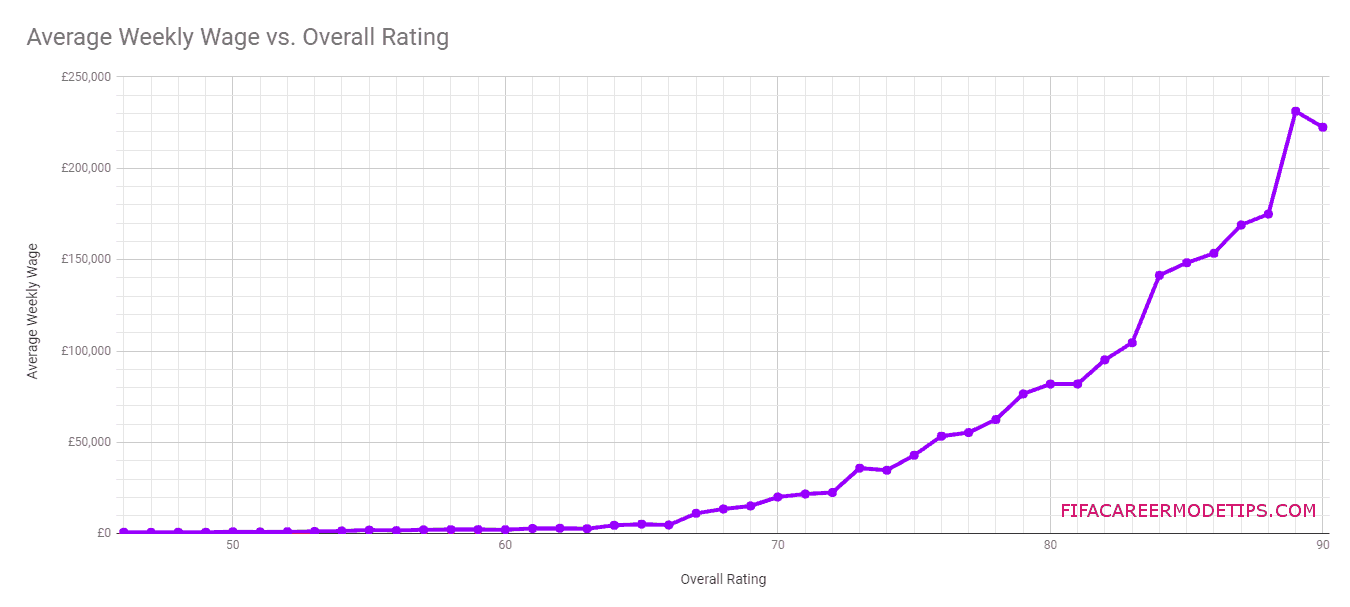
Above we have the same dataset as the previous graph, but represented as an average for each OVR Rating point on a line graph. This doesn’t do a great deal for us, except confirm the expected correlation and increased wage growth for very highly rated players. The obvious downside in trying to understand this graph is that there is a lot crammed in. The scale of each axis is rather large, making it harder to spot any smaller details in the data.
Higher Rated Players
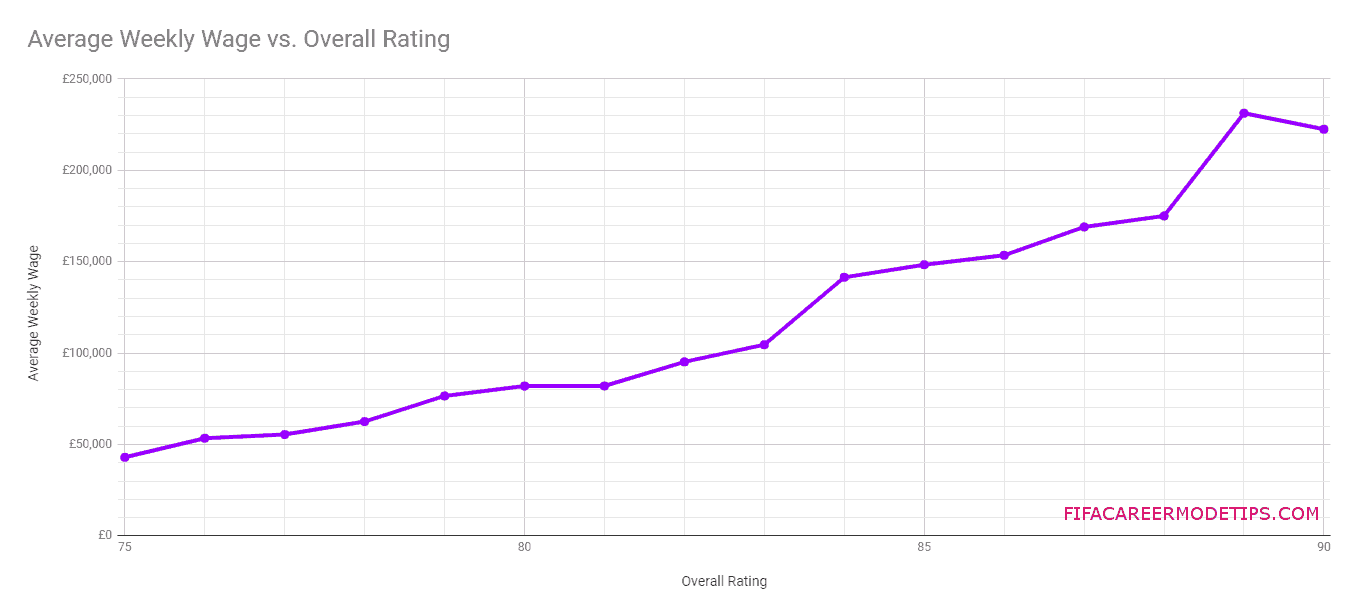
If we filter in on a certain group of players (in this case, ones rated 75 and over), our wage analysis gets a little clearer. Here, the growth looks less dramatic when not on the same graph as the lower rated players.
One interesting thing here is the fact that our data is telling us that 89-rated players are being paid more than 90-rated players. Perhaps this is trivial but the difference is almost £10,000 (remember this is a weekly wage). Looking at the data in more detail reveals that there are only six players rated 89 or 90 in the English Leagues, so again we don’t have a great sample size here. Also we can put this down to either of two things (or both):
1. One team only paying their 90-rated player £185k per week
2. Manchester City paying their 89-rated players on average £265k.
Lower Rated Players
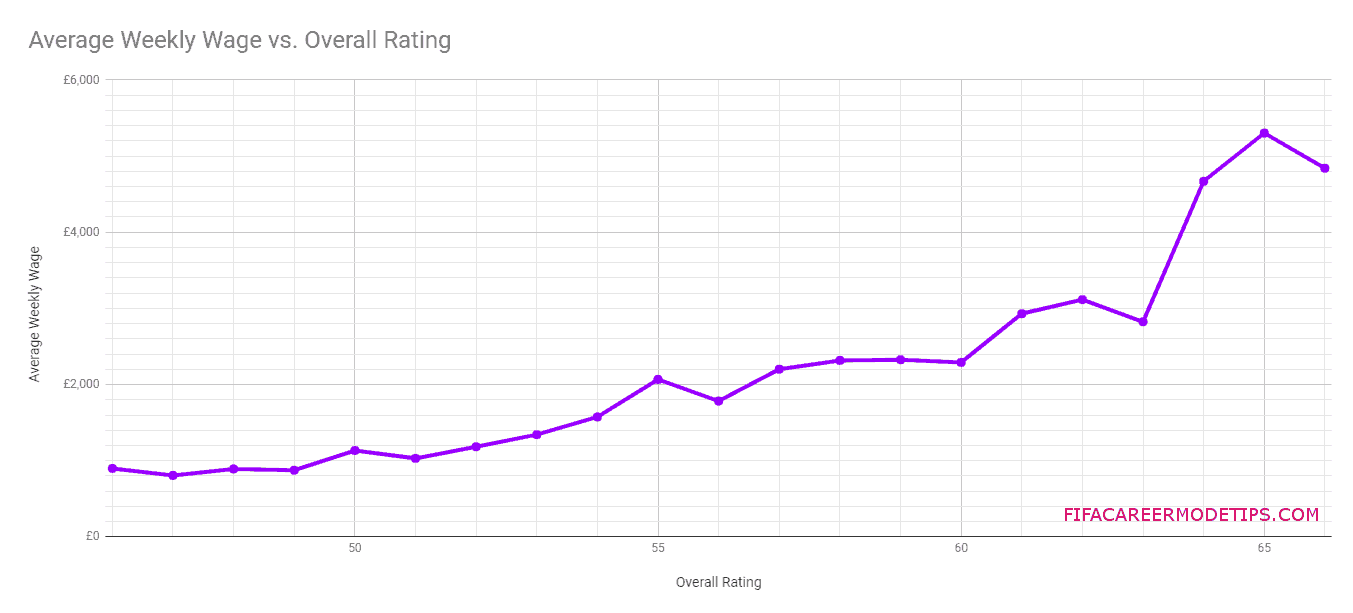
I also wanted to look at the lower end of the graph. At the previous scale, it flattened everything out too much. Again, we can see that the average doesn’t increase with each Rating point necessarily. Points 56, 63 and 66 are the most obvious examples of this. Given the considerable number of datapoints (players) at this end of the graph, we can’t put this down to small sample sizes. Expanding on a previous point, this is more likely to be due to the distribution of players between clubs.
Wage Analysis: By League
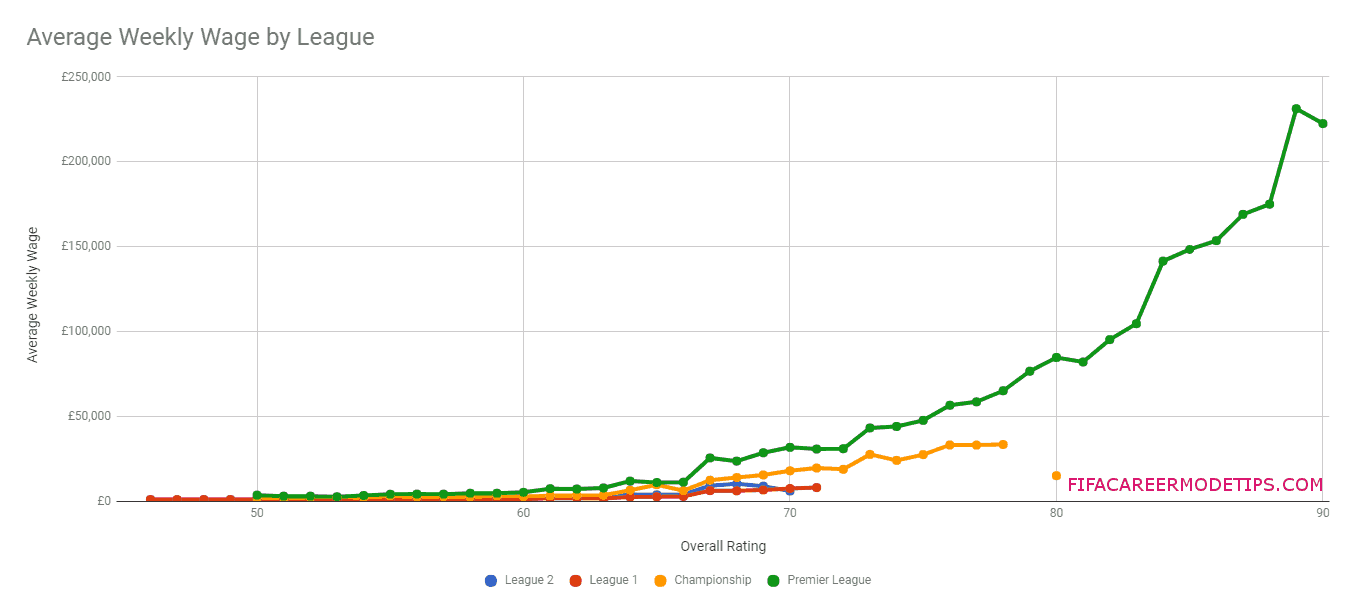
This is one of the points I really wanted to get to. Comparing how players of the same rating are paid depending on which league they play in. This has frequently been suggested as a reason why ‘transfer talks have broken down’ happens so often. Once again this first graph doesn’t show us a great deal because it is intentionally including everything. This is great to show at a glance that there seems to be a noticeable difference, but the scale doesn’t help. Also it seems pointless trying to draw conclusions on wages at player ratings that do not exist. What I mean is that there are no players rated 85-90 in the Championship for example. While comparing leagues, this wage analysis only works if we focus in on a range of ratings that all leagues have.
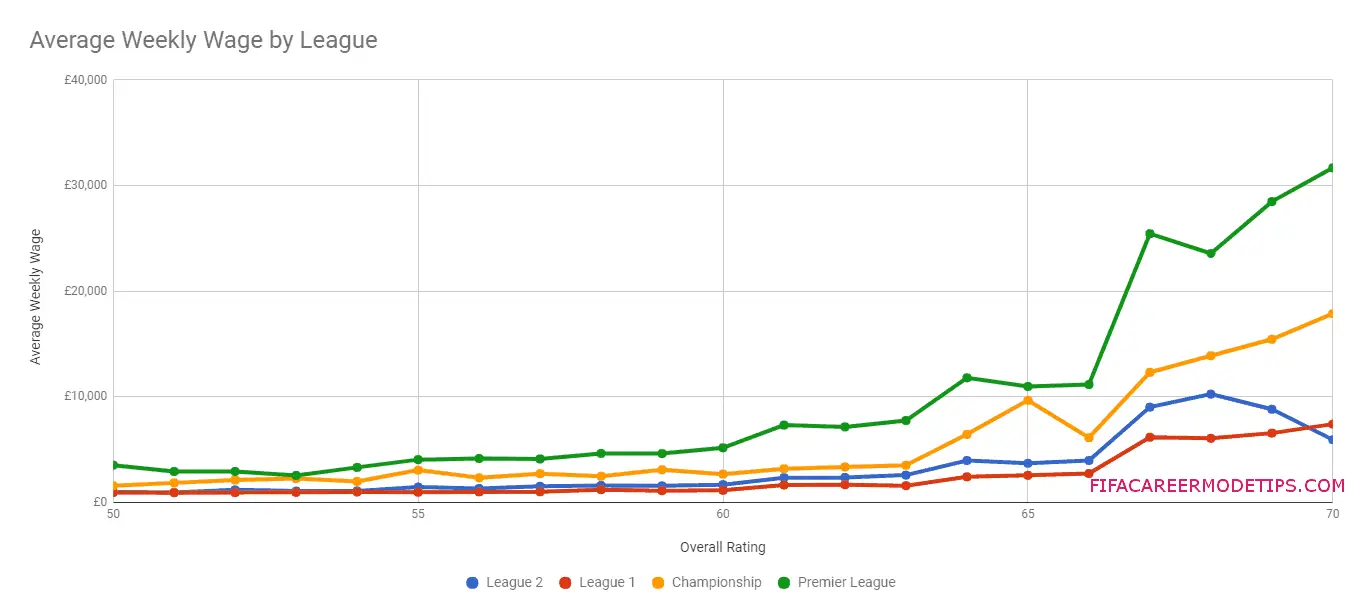
Now we’ve reduced the range of Overall Rating to 50-70, the graph becomes clearer. The lower end of the graph still remains flat, which makes it look like there isn’t much of a difference. However, players in the Premier League at this level are earning 3-4x what their League One and Two counterparts are earning. To be expected I suppose.
Moving further to the right and the differences are much clearer. The gap in earnings between the players in the four leagues is really starting to show here.
WTF?!
There was one other big thing I noticed from that graph. Did you spot it? Look again. When comparing like for like ratings, players are paid more in League Two than League One. If you’re unfamiliar with the EFL structure, League Two is below League One. I really didn’t expect this and can’t figure out why. Perhaps it’s a mistake by EA? I’m going to keep thinking on it and will update the article if I figure anything out.
I hope this has been useful or at least interesting for you. I may add more to this article in future if I get the time. I’m also aiming to use it to inform a blog post on how much to pay players.